Derui chamber
Bicycle power ratio testing is one of the most critical yet often misunderstood measurements in bicycle engineering. It quantifies how efficiently a rider’s pedaling energy is converted into forward motion through the drivetrain — or, in the case of e-bikes, how effectively the motor delivers power to the rear wheel. Whether you are a bicycle manufacturer verifying product claims, a testing lab validating compliance with EN 15194, or an R&D engineer optimizing transmission efficiency, understanding power ratio testing is essential for producing safe, competitive, and reliable bicycles.
Key Takeaways
- ISO 4210 and EN 14766 standards define mandatory test procedures, impact energy levels, and fatigue cycle requirements for bicycle frames and components.
- Accurate fixture alignment and load cell calibration are critical — misalignments of just 2-3 mm can introduce 15-20% measurement errors in fatigue testing results.
- Each component (frame, fork, saddle, brake) has distinct test parameters: frame fatigue requires 50,000-100,000 cycles while brake testing demands higher force thresholds.
- Data acquisition sampling rates of 10 kHz or higher are necessary to capture transient impact events without losing peak force data.
- Regular equipment calibration (every 6-12 months) and documented calibration certificates are essential for ISO-accredited lab compliance.
📑 Table of Contents
What Is Power Ratio in bicycle testing?
Power ratio, in the context of bicycle testing, refers to the relationship between the power input (measured at the pedals, crankset, or motor output shaft) and the power output (measured at the rear wheel contact patch). It is expressed as a percentage that represents drivetrain transmission efficiency. A well-maintained standard bicycle drivetrain typically achieves 95–97% efficiency, while e-bike power delivery systems may range from 85–95% depending on motor type, controller design, and drivetrain configuration.
The fundamental equation is straightforward: Efficiency (%) = (Power Output ÷ Power Input) × 100. However, achieving an accurate measurement requires precision instrumentation, controlled test conditions, and careful calibration — factors that make specialized testing equipment indispensable for manufacturers and certification laboratories.
For e-bikes, power ratio testing has additional regulatory significance. The European standard EN 15194 mandates that electrically power-assisted cycles (EPACs) must not exceed 250W continuous rated power. Power ratio testing verifies that the motor’s actual power delivery complies with this limit under various operating conditions, protecting manufacturers from non-compliance penalties and ensuring consumer safety.
Why Power Ratio Testing Matters
Power ratio testing serves multiple critical functions across the bicycle industry. Understanding these motivations helps manufacturers prioritize testing investments and allocate laboratory resources effectively.
Regulatory Compliance
In the European Union, EN 15194 explicitly requires power ratio verification for all EPACs. The standard mandates that the continuous rated power of the motor must not exceed 250W when measured at the wheel under specified test conditions. Non-compliance can result in product recalls, CE marking withdrawal, and significant financial penalties. Similar requirements exist under UL 2849 in the United States and GB 17761 in China, though the specific power limits and test methods differ slightly.
Product Performance Claims
Manufacturers frequently advertise drivetrain efficiency figures in marketing materials. Without rigorous power ratio testing, these claims cannot be substantiated. Independent testing with calibrated equipment provides the data needed to support marketing claims and build consumer trust. In competitive markets, verified efficiency data can be a significant differentiator — a 2% efficiency improvement translates to measurably longer range for e-bikes and faster times for racing bicycles.
Quality Control and R&D
During product development, power ratio testing helps engineers identify drivetrain losses at each component: chain engagement, gear meshing, bearing friction, and belt or shaft drive losses. This granular data guides design optimization — for example, switching from a traditional chain drive to a Gates Carbon Drive belt can reduce drivetrain losses by 1–3% under clean conditions, but this advantage must be verified through testing under realistic load and contamination scenarios.
Measurement Principles and Methodology
Accurate power ratio measurement requires simultaneous measurement of power at two points in the drivetrain: the input side and the output side. The methodology differs slightly for conventional bicycles and e-bikes, but the core principles remain the same.
Input Power Measurement
For conventional bicycles, input power is measured at the bottom bracket using a torque sensor integrated into the crankset or a dedicated bottom bracket power meter. The torque sensor measures the twisting force (in Newton-meters) applied by the rider, while a cadence sensor measures pedaling speed (in revolutions per minute). Power is calculated as: Power (W) = Torque (Nm) × Cadence (rad/s).
For e-bikes, input power is measured at the motor output shaft using a shaft-mounted torque transducer. This provides the most accurate measurement of the motor’s mechanical power output before it enters the drivetrain. Alternatively, electrical input power to the motor (voltage × current) can be measured, but this includes motor losses and does not represent mechanical output power.
Output Power Measurement
Output power is measured at the rear wheel using a dynamometer or a roller-based test bench. The dynamometer applies a controlled braking force to the wheel and measures the resulting torque and rotational speed. Modern power ratio testers use eddy-current or electromagnetic dynamometers that can precisely control the load profile, simulating real-world riding conditions including flat-road cruising, hill climbing, and stop-and-go urban riding.
Torque and Speed Accuracy Requirements
Test Equipment Overview
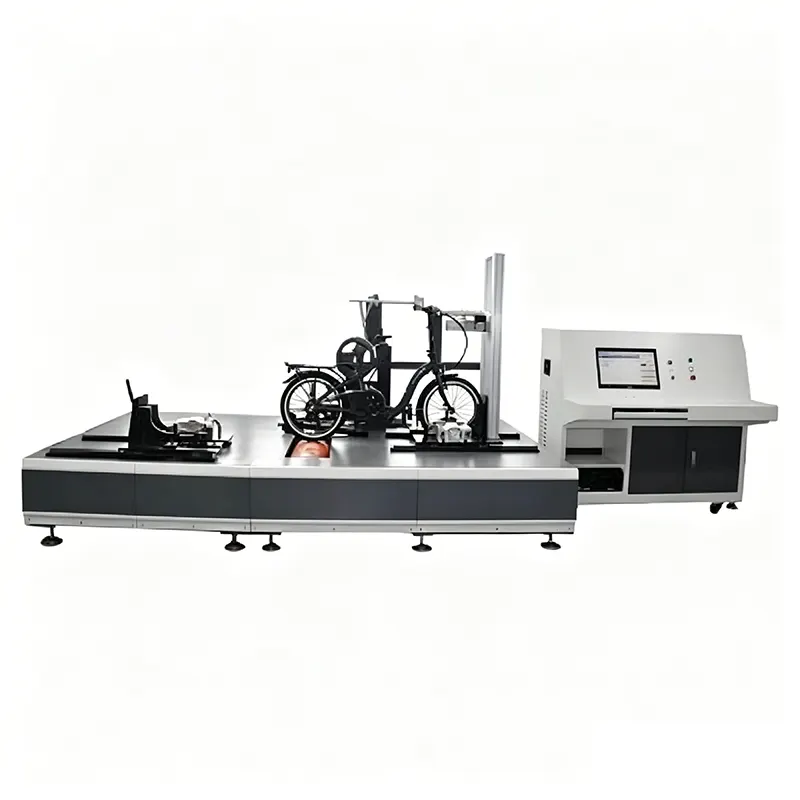
A dedicated bicycle power ratio tester integrates multiple measurement subsystems into a single controlled platform. The key components include a robust frame fixture to hold the bicycle, a power input measurement system at the crankset or motor, an output dynamometer at the rear wheel, and a data acquisition system that records and analyzes the results in real time.
💡 Key Distinction: A power ratio tester and a simulated cycling test bench serve complementary but different purposes. The power ratio tester measures instantaneous efficiency at various load points, while the cycling test bench evaluates long-term durability through extended riding simulations. Many manufacturers invest in both: the power ratio tester for product development and compliance, and the cycling bench for quality assurance and endurance validation.
Standard Test Procedure
The following procedure outlines the steps for conducting a power ratio test on a bicycle or e-bike using a dedicated testing machine. This procedure is aligned with the general principles of EN 15194 and ISO 4210 test methodologies, though specific requirements may vary by standard revision and target market.
Step 1: Bicycle Preparation and Mounting
Prepare the test bicycle with fully inflated tires (manufacturer-recommended pressure), clean and lubricated chain, and properly adjusted derailleur or hub gear. Mount the bicycle securely on the test frame, ensuring that the rear wheel sits firmly on the dynamometer roller with no slippage. Verify that the frame fixture does not impose any additional load on the frame itself that could affect drivetrain alignment. Record tire pressure, chain lubrication type, gear ratio, and ambient conditions (temperature and humidity).
Step 2: Sensor Installation and Zeroing
Install the input torque sensor at the crankset (for conventional bicycles) or motor output shaft (for e-bikes). Connect all sensors to the data acquisition system and perform a zero-offset calibration with no load applied. This step is critical — any residual offset in the torque sensor will directly translate into efficiency measurement errors. Verify sensor communication by applying a small known load and confirming the measured torque matches the expected value within the sensor’s accuracy specification.
Step 3: Warm-Up Period
Run the bicycle at 50% of the maximum test power for at least 10 minutes to warm up the drivetrain. This ensures that chain lubrication has reached steady-state distribution, tire temperature has stabilized, and bearing grease has reached operating viscosity. Efficiency measurements taken before the warm-up period will typically show 1–2% lower values than steady-state readings, which does not represent real-world performance.
Step 4: Multi-Point Efficiency Test
Measure power ratio at a minimum of 5 load points spanning the bicycle’s intended operating range. For a typical city e-bike, this might include 50W, 100W, 150W, 200W, and 250W at the wheel. At each load point, allow the system to stabilize for 30 seconds before recording data. Record at least 60 seconds of continuous data at each point and calculate the average input and output power. The efficiency curve typically shows a characteristic shape: low efficiency at very low loads (due to constant friction losses dominating), rising to peak efficiency at 60–80% of rated power, and declining slightly at maximum power.
Step 5: E-Bike Maximum Power Verification (EN 15194)
For EPACs, operate the motor at full throttle (or equivalent maximum assist setting) on the dynamometer and measure the continuous power output at the wheel over a 30-minute period. The average power over this period must not exceed 250W per EN 15194. Additionally, measure the peak power (typically limited to 500W for no more than 1 minute in some interpretations of the standard). Record the torque and speed at each measurement point to verify that the speed-limiting function (motor cutoff at 25 km/h for EU EPACs) operates correctly.
Step 6: Data Analysis and Reporting
Compile the test data into an efficiency curve showing power ratio as a function of output power or speed. Calculate the weighted average efficiency based on a representative riding profile (e.g., 40% low power urban, 30% medium power suburban, 30% high power recreational). Generate a formal test report including all raw data, calibration certificates, test conditions, and pass/fail determination for regulatory requirements.
Key Test Parameters
Factors Affecting Drivetrain Efficiency
Understanding the factors that influence drivetrain efficiency enables engineers to optimize bicycle designs and set realistic performance expectations. The major loss mechanisms in a bicycle drivetrain include chain friction (accounting for approximately 1–3% total loss), gear meshing losses (0.5–1.5% per gear pair), bearing friction (0.5–1%), and belt or shaft drive losses (0.5–2% depending on design). Each of these loss mechanisms responds differently to load, speed, lubrication, and environmental conditions.
Chain Drive Efficiency
Chain drives remain the most efficient transmission system for bicycles under clean, well-lubricated conditions. A properly maintained 11-speed or 12-speed chain on a modern derailleur system achieves 96–98% efficiency in the primary riding gears. However, efficiency drops significantly when using extreme cross-chaining combinations (e.g., large chainring with largest cassette cog), where chain articulation angles increase and additional friction occurs at the derailleur pulleys. Internal gear hubs (IGH) typically show 92–97% efficiency depending on the gear ratio selected, with direct-drive gears being most efficient and reduction or overdrive gears showing progressively lower efficiency.
Belt Drive Efficiency
Carbon fiber reinforced polyurethane belts (such as Gates Carbon Drive) offer 95–98% efficiency under ideal conditions — comparable to chain drives. Their main advantage is reduced maintenance and consistent efficiency in wet conditions, where chain efficiency typically drops 2–4% due to water displacing lubricant. Belt drives are increasingly popular on commuter and urban e-bikes, where reliability and low maintenance are valued over the last percentage point of efficiency.
Environmental and Contamination Effects
Real-world riding conditions significantly impact drivetrain efficiency. Dust, mud, and road grit contaminate the chain and increase friction by 2–5% compared to clean laboratory conditions. Water exposure without proper lubrication can reduce chain efficiency by 3–6%. These factors explain why laboratory-measured efficiency values are typically 2–4% higher than what riders experience in real-world conditions. When quoting efficiency figures, manufacturers should specify test conditions and distinguish between “lab efficiency” and “real-world efficiency” to maintain credibility with informed consumers.
E-Bike Power Ratio and Regulatory Compliance
For e-bike manufacturers, power ratio testing is not optional — it is a regulatory requirement in every major market. The specific test conditions and power limits vary by region, but the fundamental approach is the same: measure the motor’s power output under controlled conditions and verify compliance with the applicable limit.
Manufacturers targeting multiple markets should design their motor and controller systems to comply with the most stringent requirement (typically EN 15194’s 250W limit) and use software-configurable power profiles to meet different market requirements without hardware changes. Power ratio testing validates that these software configurations correctly limit motor output under all operating conditions — not just at a single test point, but across the full speed and load range.
Data Analysis and Reporting
Effective data analysis transforms raw test data into actionable engineering insights and regulatory documentation. A comprehensive power ratio test report should include the following elements:
- Efficiency vs. Power curve: Plot power ratio (Y-axis) against output power (X-axis) for all test points. Include error bars representing the measurement uncertainty at each point. Identify the peak efficiency point and the efficiency at rated power.
- Efficiency vs. Speed curve: For variable-speed tests, plot efficiency against wheel speed. This is particularly relevant for mid-drive motors where efficiency varies significantly with cadence.
- Torque vs. Speed characteristics: Plot the motor or drivetrain torque-speed operating envelope. Verify that the power output (torque × speed product) remains within the regulatory limit across the full speed range.
- Thermal drift analysis: If the test runs for extended periods, plot efficiency over time to identify any thermal drift. Motor efficiency typically decreases 1–3% as motor temperature rises from cold to thermal equilibrium.
- Regulatory compliance statement: A clear pass/fail determination for each applicable regulation, with supporting data tables and raw data appendices.
Frequently Asked Questions
Q1: What is a good power ratio for a bicycle drivetrain?
A well-maintained modern chain drivetrain in the primary riding gear achieves 96–98% efficiency in laboratory conditions. Internal gear hubs range from 92–97% depending on the selected gear ratio. Belt drives achieve 95–98% under clean conditions. In real-world riding with contamination, expect 2–4% lower values across all drivetrain types.
Q2: How often should power ratio testing be performed?
For type approval certification, power ratio testing is performed once per model during the initial certification process. For production quality control, periodic batch testing (e.g., every 500 units or monthly) is recommended. Additionally, re-testing is required whenever motor controller software is updated, drivetrain components change suppliers, or a new motor variant is introduced.
Q3: Can I use a consumer cycling power meter for compliance testing?
No. Consumer power meters (such as those from SRAM, Shimano, or Favero) have typical accuracy of ±1.5–2%, which is insufficient for regulatory compliance testing. Certification requires laboratory-grade torque sensors with ±0.5% accuracy or better, documented calibration traceable to national standards, and verified measurement uncertainty calculations. Consumer power meters are useful for field validation but cannot replace dedicated test equipment for compliance purposes.
Q4: How does temperature affect power ratio measurements?
Temperature affects drivetrain efficiency through multiple mechanisms. Higher temperatures reduce lubricant viscosity, which can slightly improve chain efficiency (0.5–1%) but worsen motor efficiency due to increased copper losses in windings (1–3%). Bearing grease thins at higher temperatures, reducing bearing friction. The net effect depends on the specific drivetrain configuration. For consistent results, always test in a temperature-controlled environment (23°C ± 5°C) and report the ambient temperature in the test documentation.
Q5: What is the difference between peak power and continuous rated power?
Peak power is the maximum instantaneous power the motor can deliver, typically for a short duration (1–30 seconds depending on the standard). Continuous rated power is the average power the motor can sustain indefinitely without overheating. EN 15194 limits continuous rated power to 250W, measured as a 30-minute average. Many motors can briefly deliver 500W or more for acceleration or hill climbing, but this peak power must not cause the 30-minute average to exceed the regulatory limit.
Q6: How much does chain wear affect power ratio?
A worn chain (stretched beyond 0.75% elongation) typically shows 1–2% lower efficiency than a new chain due to increased friction at the link interfaces and poorer engagement with the cassette and chainring teeth. Severely worn chains (beyond 1.0% elongation) can show 3–5% efficiency loss and pose a safety risk of chain breakage under load. For accurate power ratio testing, always use a new or recently replaced chain that meets the manufacturer’s specification for wear limits.
Q7: Can power ratio testing be combined with other bicycle tests?
Yes. Many manufacturers integrate power ratio measurement into broader test sequences. For example, a combined test protocol might include power ratio measurement at the start of the test, followed by a prolonged durability test on a simulated cycling bench, with periodic power ratio checks to monitor efficiency degradation over time. This approach provides both compliance data and real-world durability information from a single test setup, maximizing the value of each test specimen.
Q8: What is the typical cost of a bicycle power ratio tester?
Dedicated bicycle power ratio testers range from $10,000 to $25,000 depending on the power capacity, accuracy class, motor types supported, and software capabilities. Higher-end models include integrated temperature compensation, automated test sequence programming, and direct compliance report generation per EN 15194. Annual calibration costs typically range from $500 to $1,200 depending on the number of sensor channels and the calibration provider.
Q9: How do mid-drive and hub motor e-bikes differ in power ratio testing?
Mid-drive motors transmit power through the bicycle’s chain drivetrain, so power ratio testing measures combined motor and drivetrain efficiency. Hub motors drive the wheel directly, bypassing the chain. For mid-drive testing, the input measurement point is at the motor output shaft (before the chain), and output is at the wheel. For hub motors, input is at the motor terminals or shaft and output is at the tire contact patch. Hub motors typically show higher overall system efficiency (88–95%) because they eliminate chain losses, but mid-drive systems offer better weight distribution and the ability to use the bicycle’s gears for optimal motor operating speed.
Q10: What should I do if my e-bike fails the EN 15194 power limit test?
First, verify the test setup and calibration before redesigning anything. Common causes of unexpected failures include incorrect controller software configuration (the power limit parameter may be set too high), temperature compensation issues (cold motors produce more power), and test fixture errors (incorrect roller diameter causing speed measurement errors). If the test setup is confirmed correct, work with the motor and controller supplier to adjust the power limiting algorithm. Most modern controllers allow software-configurable power limits that can be adjusted without hardware changes. Re-test after any adjustment to confirm compliance.
Conclusion
Bicycle power ratio testing is a fundamental capability for any manufacturer producing bicycles or e-bikes for international markets. It serves three essential functions: verifying regulatory compliance with power limits defined by EN 15194, UL 2849, and GB 17761; validating product performance claims with rigorous data; and providing engineering insights that drive drivetrain optimization and efficiency improvements.
Investing in a dedicated power ratio tester — with properly calibrated torque sensors, a precision dynamometer, and automated data acquisition — provides the measurement accuracy needed for certification and the flexibility to support ongoing product development. Combined with complementary test equipment such as simulated cycling benches for endurance validation, a power ratio tester forms the foundation of a comprehensive bicycle testing laboratory.
Related Products
Need Professional Bicycle Testing Equipment?
Explore our range of testing machines designed for compliance with international standards.