Derui chamber
Electric scooters have transformed urban mobility, with the motor serving as the critical powertrain component that determines performance, reliability, and safety. For manufacturers seeking to build scooters that withstand real-world conditions over thousands of kilometers, comprehensive motor durability testing is not optional—it is essential. This guide examines industry best practices for scooter motor durability testing, covering test methodologies, equipment specifications, standard requirements, and practical implementation strategies that quality-focused manufacturers follow to ensure their products exceed customer expectations.
Key Takeaways
- UL 2272 and EN 17128 are the primary safety standards governing e-scooter electrical and mechanical performance testing requirements.
- Frame fatigue testing for e-scooters requires higher impact energy levels compared to conventional bicycles due to additional battery and motor mass.
- Tire, wheel, and axle endurance tests simulate real-world urban riding conditions across varied road surfaces and loading scenarios.
- Brake system testing evaluates both mechanical and regenerative braking efficiency under dry and wet conditions per applicable standards.
- Environmental testing (IP rating, temperature cycling) ensures e-scooter safety across diverse operating climates and weather conditions.
📑 Table of Contents
Why Motor Durability Testing Matters
The electric motor in a scooter operates under demanding conditions: frequent start-stop cycles, varying loads, temperature fluctuations, and exposure to environmental contaminants. A motor failure on a scooter does not merely inconvenience the rider—it can create dangerous situations, especially when occurring at speed or in traffic. Manufacturers who skip comprehensive durability testing risk costly recalls, warranty claims, and reputational damage that far exceeds the investment in proper testing protocols.
Motor durability testing validates that the powertrain will deliver rated performance throughout the product’s intended service life. For shared mobility operators who expect scooters to survive multiple users daily over 12-24 months, and for consumers who expect personal vehicles to last 3-5 years, durability data provides the confidence that specifications translate to real-world reliability. Testing also identifies design weaknesses before mass production, allowing engineers to improve thermal management, bearing selection, winding insulation, and other critical parameters.
From a regulatory perspective, several standards reference motor performance and durability. EN 17128:2020 for light motorized vehicles includes requirements for motor temperature rise and continuous operation capability. UL 2272 for electrical systems in personal e-mobility devices addresses motor insulation and thermal protection. While these standards do not prescribe specific durability test cycles, manufacturers must demonstrate that motors meet safety requirements under expected operating conditions, which durability testing validates.
Key Test Parameters and Standards
Effective motor durability testing evaluates multiple performance parameters simultaneously. The primary metrics include power output degradation, efficiency loss over time, temperature rise under load, mechanical wear indicators, and insulation resistance. Each parameter reveals different aspects of motor health and helps predict remaining useful life.
Power and Efficiency Metrics
Power output testing measures the motor’s ability to deliver rated wattage throughout the durability cycle. A well-designed motor should maintain at least 90% of initial power output after completing the full test duration. Efficiency testing tracks energy conversion performance—typically, motors achieve 78-85% efficiency at rated load, and durability testing validates that this efficiency does not degrade significantly. A drop of more than 3-5 percentage points in efficiency signals problems with magnetic properties, bearing friction, or thermal management.
Thermal Performance Requirements
Temperature rise is a critical durability metric because excessive heat degrades insulation, reduces magnetic efficiency, and accelerates bearing wear. Standards typically specify maximum temperature rise above ambient—often 75°C for Class B insulation systems or 95°C for Class F. Testing must verify that under worst-case operating conditions (maximum load, minimum cooling, high ambient temperature), motor temperatures remain within safe limits. Thermal cycling tests that alternate between high load and cooling periods evaluate the motor’s ability to handle repeated thermal stress without insulation breakdown.
Mechanical Endurance Factors
Mechanical durability testing evaluates bearings, shafts, and structural components. Hub motors face unique challenges because the motor bearings support the wheel and rider weight while handling radial and axial loads during cornering. Testing should include load cycling that simulates these forces. For mid-drive motors, the testing must account for chain or belt tension forces and gear train stress. Bearing selection—typically sealed deep-grove ball bearings for hub motors—should be validated for L10 life exceeding 10,000 hours under expected load conditions.
Essential Testing Equipment
Professional motor durability testing requires specialized equipment capable of applying controlled loads, measuring performance parameters, and recording data over extended periods. A dedicated Electric Scooter Motor Durability Test Machine provides the most comprehensive and reliable testing capability for manufacturers.
Motor Test Machine Features
A quality motor durability test machine includes several essential subsystems. The dynamometer section applies precise mechanical loads using eddy current brakes or magnetic powder brakes, allowing simulation of riding conditions from flat cruising to steep hill climbing. Temperature sensors—typically thermocouples or RTDs—monitor motor windings, case temperature, and ambient conditions. Power analyzers measure voltage, current, power factor, and efficiency in real-time. Data acquisition systems record all parameters at programmable intervals, typically 1-10 second sampling rates for long-duration tests.
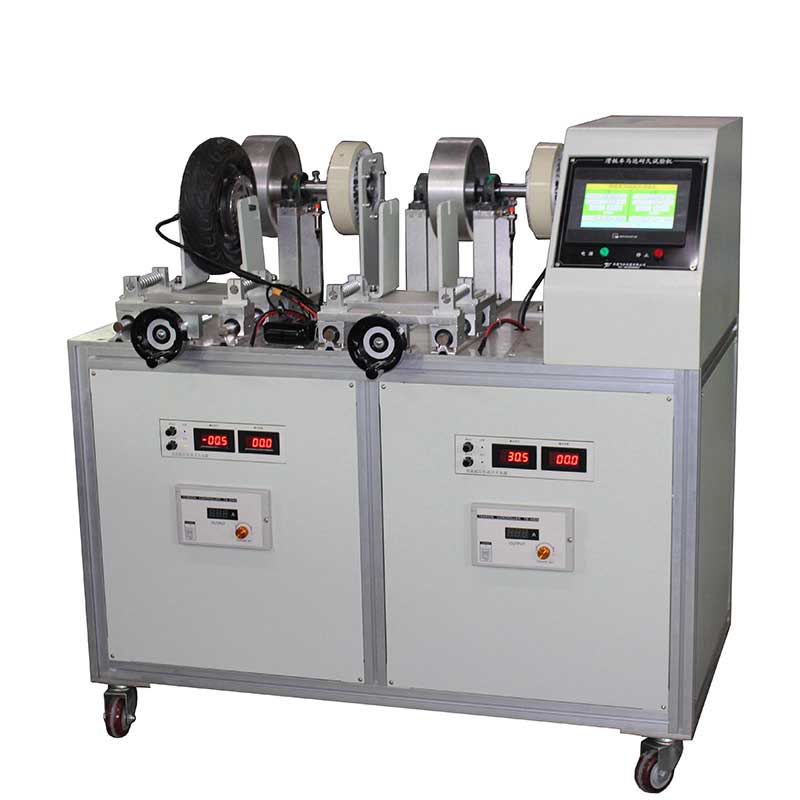
The control system enables programmable test profiles that vary load, speed, and duty cycles to simulate real-world usage patterns. Advanced test machines support multiple test stations, allowing simultaneous testing of several motors under identical or different conditions. Safety interlocks protect operators and equipment from thermal runaway, mechanical failures, or electrical faults during unattended overnight and weekend test runs.
Step-by-Step Testing Procedure
A comprehensive motor durability test follows a structured procedure to ensure consistent, repeatable results. The following protocol represents industry best practices for hub motor testing, adaptable for mid-drive configurations with appropriate modifications.
Step 1: Pre-Test Inspection and Documentation
Before testing begins, conduct a thorough visual and electrical inspection of each motor. Document the motor serial number, manufacturer specifications, and any pre-existing conditions. Measure and record initial winding resistance for each phase using a micro-ohmmeter—typical values for scooter motors range from 0.05 to 0.5 ohms depending on power rating. Check insulation resistance between windings and case using a megohmmeter at 500V DC; readings should exceed 20 megaohms for motors in good condition. Spin the motor by hand to verify smooth operation and note any bearing noise or drag.
Step 2: Mounting and Setup
Mount the motor securely to the test fixture, ensuring proper alignment between the motor shaft and dynamometer coupling. Misalignment causes vibration and premature bearing wear that invalidates test results. Install temperature sensors—typically embedded thermocouples in the windings plus surface sensors on the case. Connect power leads to the motor controller, ensuring all connections are properly torqued and insulated. Configure the data acquisition system with appropriate channels, ranges, and sampling intervals. Verify all safety interlocks and emergency shutdown systems are functional.
Step 3: Baseline Performance Testing
Run a complete performance characterization before starting the durability cycle. This includes measuring no-load speed and current at rated voltage, followed by loaded tests at 25%, 50%, 75%, 100%, and 125% of rated torque. At each operating point, record speed, voltage, current, power input, power output, efficiency, and temperatures. Calculate and document the torque constant (Kt) and speed constant (Kv) from these measurements. The baseline data provides reference values for assessing degradation during and after durability testing.
Step 4: Durability Cycle Execution
Execute the durability test profile according to the test plan. A typical profile includes repeated cycles of: (1) acceleration to rated speed under partial load, (2) steady-state operation at rated load and speed, (3) increased load simulating hill climbing, (4) deceleration with regenerative braking if applicable, and (5) rest period for partial cooling. Each cycle might last 10-30 minutes, with the complete test running 200-500 cycles depending on requirements. Monitor all parameters continuously and flag any readings that exceed preset limits. Conduct interim performance checks at 25%, 50%, and 75% of planned test duration to track degradation trends.
Step 5: Post-Test Evaluation
After completing the durability cycles, repeat the full baseline performance characterization. Compare pre-test and post-test data to quantify any degradation. Disassemble the motor for physical inspection—examine bearings for wear patterns, check winding insulation for discoloration or cracking, inspect magnets for corrosion or demagnetization, and measure any shaft or bearing play. Document all findings with photographs and measurements. Motors that meet performance criteria without significant physical degradation pass the durability test and are suitable for production use.
Interpreting Test Results
Understanding test results requires comparing measured values against acceptance criteria while considering the relationship between parameters. A motor might pass individual criteria but still indicate problems when analyzing trends across multiple measurements.
Performance Degradation Analysis
Normal motor aging causes gradual, predictable changes in performance. Power output might decrease 2-5% after initial run-in as bearing lubricant distributes and electrical connections settle. Efficiency typically improves slightly during the first 50-100 hours as friction decreases, then gradually declines over motor life. Temperature rise should remain stable or increase slightly (under 10%) as thermal interfaces age. Accelerated degradation—power drops exceeding 10% in the first 200 hours, efficiency loss exceeding 5 percentage points, or temperature rise increasing over 15%—indicates design or manufacturing problems requiring investigation.
Failure Mode Identification
Test data analysis identifies failure modes before catastrophic failure occurs. Sudden efficiency drops with increased temperature suggest winding insulation breakdown causing shorted turns. Gradual efficiency decline with audible bearing noise indicates bearing failure. Increased current draw at no-load signals mechanical drag from failed seals or contaminated bearings. Intermittent performance variations often indicate loose connections or controller issues rather than motor problems.
Common Failure Modes and Prevention
Understanding common failure modes helps engineers design more robust motors and helps quality teams identify problems during testing. The following failure modes account for over 90% of motor durability failures in electric scooter applications.
Bearing Failure
Bearings are the most common mechanical failure point, especially in hub motors where they support wheel loads. Failure mechanisms include lubricant breakdown from overheating, contamination ingress through failed seals, and fatigue spalling from overload. Prevention strategies include selecting bearings rated for at least double the expected load, specifying high-temperature lubricant (such as polyurea-based grease rated for 150°C+), and designing effective sealing systems with labyrinth seals and O-rings. For hub motors in wet environments, consider sealed stainless steel bearings with specialized marine-grade lubricant.
Winding Insulation Breakdown
Thermal stress causes insulation breakdown as temperature cycling creates mechanical stress in the winding. Over time, insulation cracks or delaminates, allowing shorted turns that rapidly cascade to complete failure. Prevention requires proper thermal design—calculate temperature rise under worst-case conditions and specify insulation class accordingly. Class F (155°C maximum) or Class H (180°C maximum) insulation provides margin for demanding applications. Ensure proper impregnation with high-grade varnish to eliminate air pockets that cause hot spots. Consider potting compounds for motors exposed to vibration or moisture.
Thermal Management Failures
Motors that overheat during durability testing indicate inadequate thermal design. Hub motors face particular challenges because they have limited surface area for heat dissipation and are enclosed in wheel structures. Prevention includes optimizing magnetic design to minimize losses (using high-grade electrical steel with thin laminations), adding thermal paths from windings to case (such as thermally conductive potting), and ensuring adequate airflow or heat sinking in the vehicle design. Some high-performance hub motors incorporate liquid cooling passages for sustained high-load operation.
Quality Control Integration
Durability testing provides the most value when integrated into a comprehensive quality management system. Test results inform design improvements, production quality checks, and supplier evaluation processes.
Production Lot Testing
For ongoing production, implement statistical lot testing using abbreviated durability cycles. A production verification test might run 50-100 hours—sufficient to identify infant mortality failures and manufacturing defects without the time and cost of full durability testing. Test a representative sample from each production lot (typically 1-5% depending on volume and historical defect rates). Motors failing production tests trigger lot holds and root cause investigation before shipment.
Supplier Qualification
When evaluating motor suppliers, durability testing provides objective comparison data beyond catalog specifications. Test samples from multiple suppliers under identical conditions using the same test profiles. Compare not just pass/fail results but degradation trends—two motors might both pass but one shows 8% efficiency loss while the other shows only 2%. These differences predict long-term reliability in the field. Document supplier testing results and maintain traceability to support future sourcing decisions.
Continuous Improvement
Durability testing data feeds continuous improvement programs. Track failure modes and their frequency across test runs and production lots. Pareto analysis identifies the most impactful failure modes to address. When design changes are proposed, durability testing validates that changes improve rather than degrade reliability. Archive test data and samples for reference when investigating field failures—comparing a failed motor to tested samples helps identify whether the failure represents a design issue or isolated defect.
Related Products
- ▸ EN 17128 E-scooter testing Requirements Guide
- ▸ E-scooter testing FAQ for Manufacturers
- ▸ EN 14619 vs EN 17128 Standards Comparison
FAQ: Scooter Motor Testing
Q: How long should a motor durability test run?
A: Test duration depends on the intended service life and duty cycle. For scooters expected to operate 2-4 hours daily over 2-3 years, a 500-hour test at accelerated conditions typically validates durability. Shared mobility vehicles may require 1000+ hour tests to simulate higher usage intensity.
Q: What power rating should the test equipment have?
A: Test equipment should handle at least 150% of the maximum motor power to provide margin for overload testing and accommodate future higher-power products. For a 500W motor, specify a test system rated for 750W minimum, ideally 1000W for flexibility.
Q: Can durability testing predict motor service life?
A: Yes, with proper analysis. By correlating degradation rates during testing with expected operating conditions, engineers can estimate service life. A motor showing 5% degradation in 500 hours of accelerated testing might last 10,000+ hours in normal use, assuming linear degradation.
Q: What is the acceptable efficiency loss over a durability test?
A: Efficiency loss should not exceed 3-5 percentage points over the complete test. Greater loss indicates problems with magnetic degradation, bearing wear, or insulation breakdown. Motors showing over 5% loss require investigation and likely design improvements.
Q: How are hub motors tested differently from mid-drive motors?
A: Hub motors require testing with applied radial and axial loads to simulate wheel forces, while mid-drive motors focus on chain/belt tension and gear train stress. Hub motor test fixtures must accommodate the wheel mounting configuration; mid-drive fixtures require chain/belt tensioning systems.
Q: What temperature monitoring is required during testing?
A: Monitor winding temperature (via embedded sensors or resistance method), case temperature at multiple locations, ambient temperature, and cooling air temperature if applicable. Sampling intervals of 1-10 seconds capture thermal transients while managing data volume for long-duration tests.
Q: Should motors be tested with their original controllers?
A: Ideally, yes—the controller affects motor performance and thermal behavior. However, for comparative testing across motor designs, using a standardized controller eliminates this variable. Document the controller used and its settings for result traceability.
Q: What acceptance criteria should manufacturers use?
A: Minimum criteria include: power output ≥85% of rated after testing, efficiency ≥75%, temperature rise ≤75°C above ambient, no abnormal noise or vibration, and no physical damage visible upon inspection. Target criteria should be stricter—90%+ power and 80%+ efficiency—to ensure production margin.
Need Professional E-Scooter Testing Equipment?
Explore our range of testing machines designed for compliance with international standards.